673
Admitted male students
1010
Admitted female students
222
Graduate male students
763
Graduate female students
Admission Statistics and Graduation Statistics for CS Program Students from the Academic Year 2015-2016 to 2021-2022.
Table 1 below shows admission statistics and the graduation statistics for CS Program students from the academic year 2015-2016 to 2021-2022. Figure 1 shows the comparison between admitted and graduated students in CS Program from year 2015-2016 to 2021-2022.
Figure 1 shows the comparison between admitted and graduated students in CS Program from year 2015-2016 to 2021-2022.
Table 1: Admission statistics and the graduation statistics for CS Program students from the academic year 2015-2016 to 2021-2022
|
Academic
Year
|
Section |
No. of Admitted Students |
Graduated
Successfully
|
Regular |
|
2015-2016
|
Male |
70 |
31 |
7 |
|
Female |
118 |
107 |
1 |
|
2016-2017
|
Male |
72 |
23 |
15 |
|
Female |
120 |
103 |
3 |
|
2017-2018
|
Male |
77 |
19 |
26 |
|
Female |
140 |
94 |
33 |
|
2018-2019
|
Male |
126 |
29 |
77 |
|
Female |
157 |
90 |
132 |
|
2019-2020
|
Male |
121 |
35 |
81 |
|
Female |
151 |
118 |
135 |
2020-2021
|
Male |
106 |
35 |
87 |
|
Female |
162 |
143 |
144 |
2021-2022
|
Male |
101 |
50 |
39 |
|
Female |
162 |
108 |
43 |
|
Total |
|
1683 |
1024 |
823 |
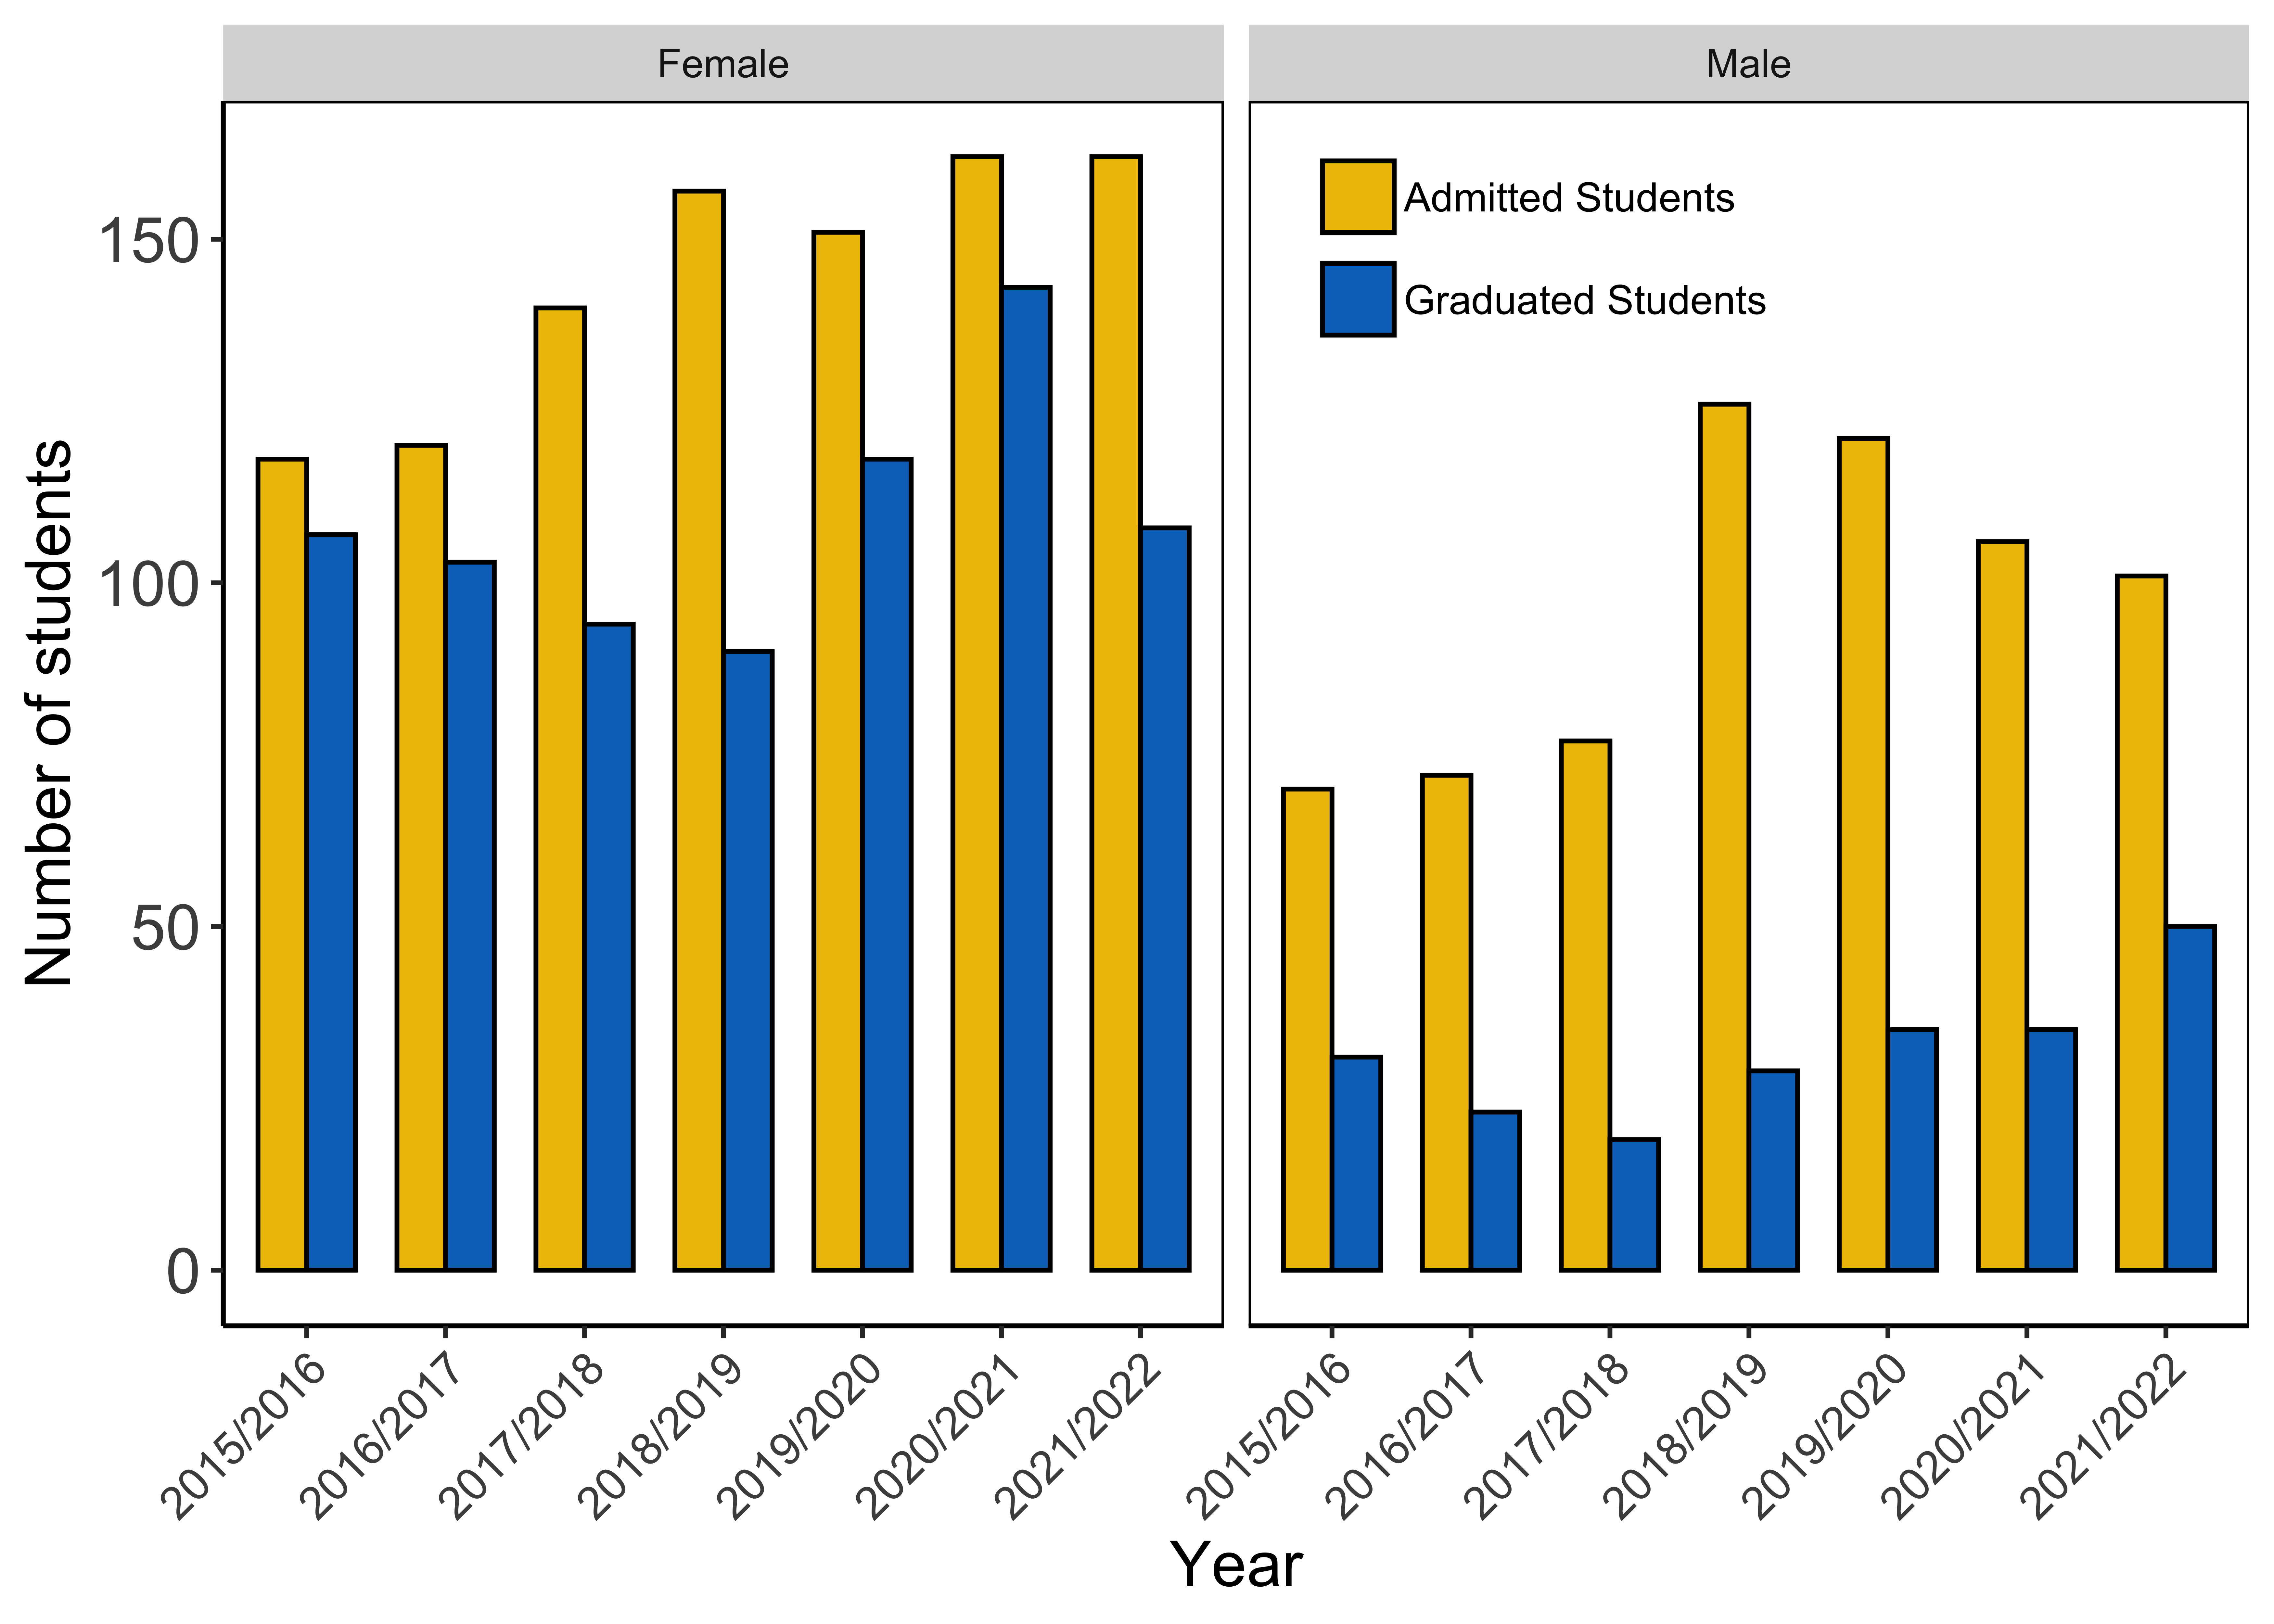
Figure 1: Number of admitted and graduated students in CS Program from year 2015-2016 to 2021-2022